|
|
|
|
◎ 2021
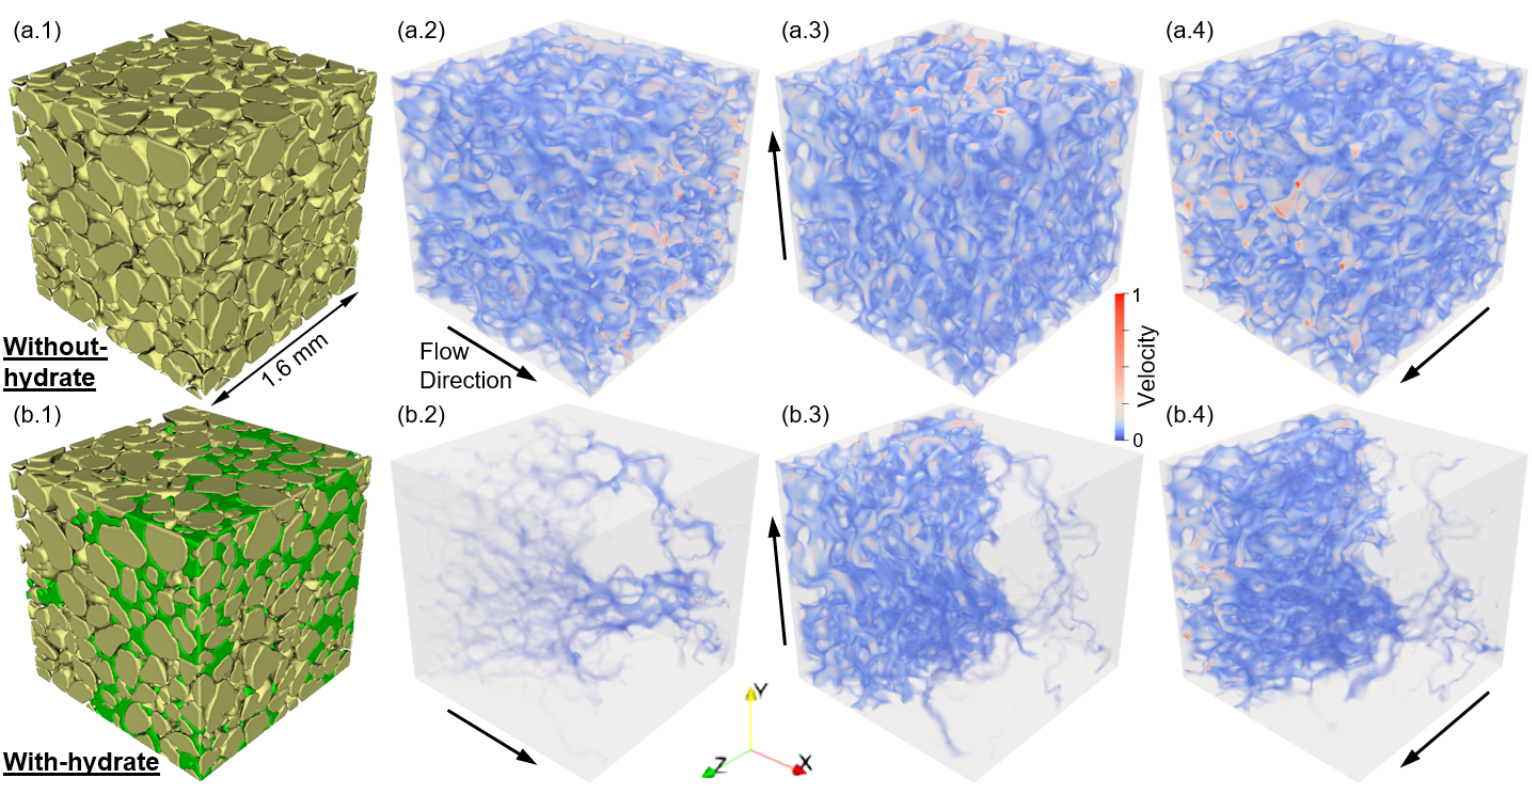
1. Pan, L.L., Lei, L.*, Seol, Y. (2021). "Pore-scale influence of methane hydrate on permeability of porous media." Journal of Natural Gas Science and Engineering, 87, 103758. https://doi.org/10.1016/j.jngse.2020.103758
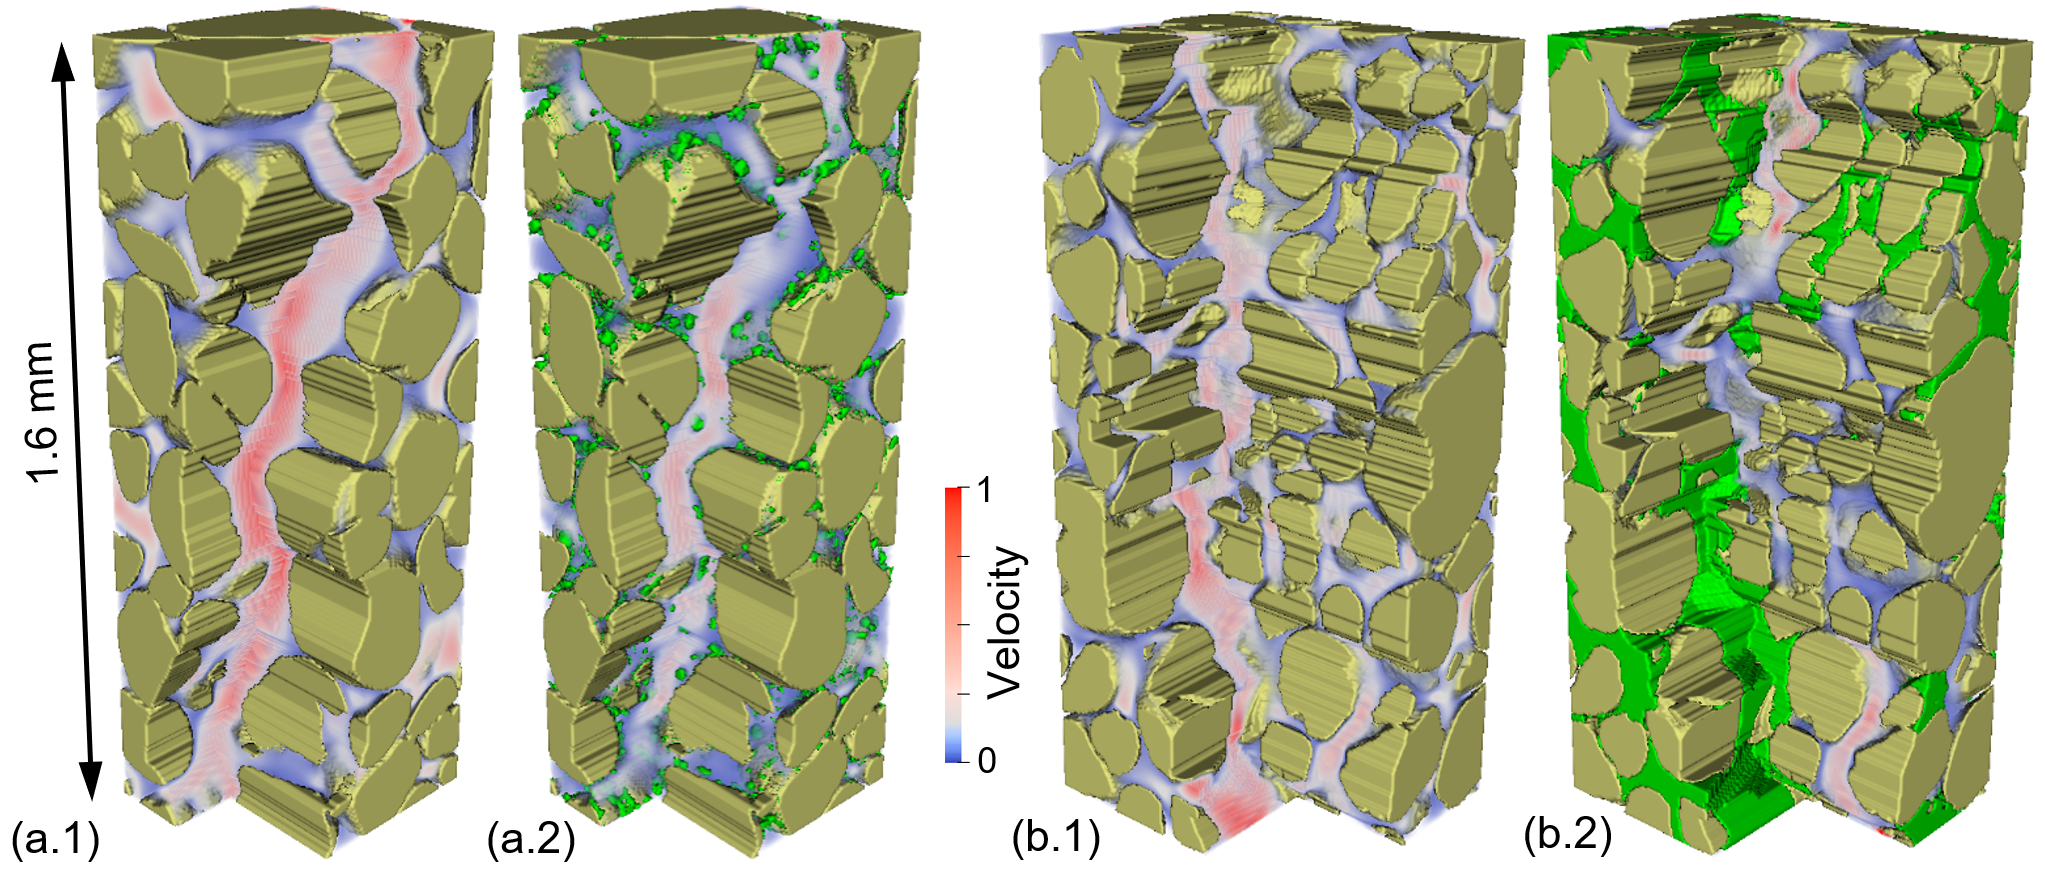
(left)Effect of hydrate on geometry of flow path and velocity fields. (a) and (b) show the effect of actual hydrate distribution with hydrate saturation of 8.0% (Dataset 1) and 71.5% (Dataset 19). Note the blocks with one major flow path in (a) and (b) are cut from the cubic simulation domains for demonstration purposes.
(right)Unevenly distributed hydrate induced permeability anisotropy (Dataset 17, Sh = 41.9%). (a–b) show Without-hydrate case and With-hydrate case. (a/b.1-a/b.4) present 3D pore structure, and flow velocity fields along X, Y and Z directions.
◎ 2020
1. Choi, J.H.*, Myshakin, E.M., Lei, L., Kneafsey, T.J., Seol, Y.* (2020). "An experimental system and procedure of unsteady-state relative permeability test for gas hydrate-bearing sediments." Journal of Natural Gas Science and Engineering, 83, 103545. https://doi.org/10.1016/j.jngse.2020.103545
2. Lei, L., Gai, X.R., Seol, Y.* (2020). "Load-bearing characteristic of methane hydrate within coarse-grained sediments-Insights from isotropic consolidation." Marine and Petroleum Geology, 121,104571. https://doi.org/10.1016/j.marpetgeo.2020.104571
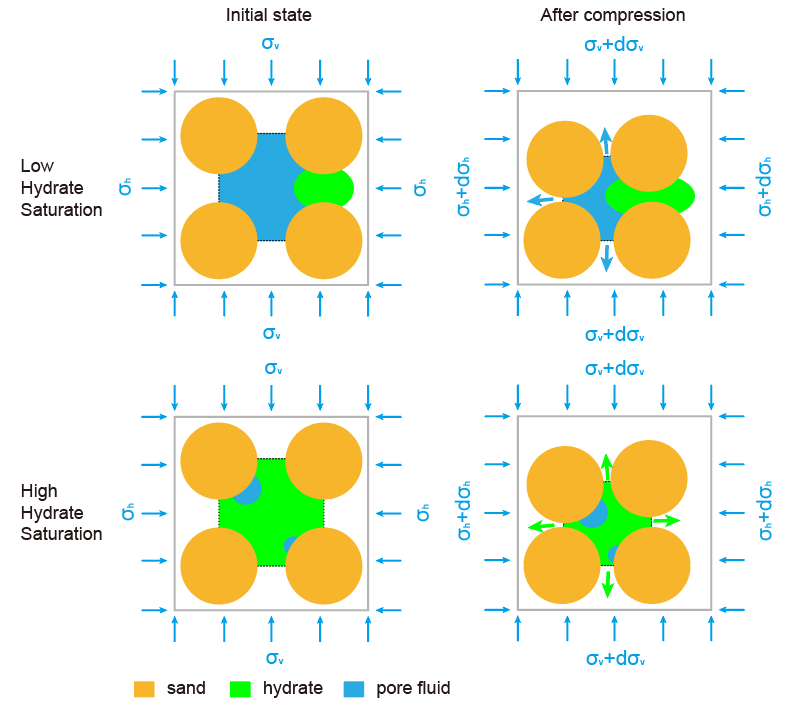
Pore scale mechanism of pore pressure dissipation under external loading at different hydrate saturations. Compression of sediment skeleton squeezes pore fluid out when pore fluid can percolate in low hydrate saturation environments, but have to squeeze hydrate out when hydrate saturation is high.
3. White, M.D.*, Kneafsey, T.J., Seol,Y., Waite, W.F., Uchida, S., Lin, J.S., Myshakin, E.M., Gai, X., Gupta, S., Reagan, M.T., Queiruga, A.F., Kimoto, S., IGHCCS2 Participants. (2020). "An international code comparison study on coupled thermal, hydrologic and geomechanical processes of natural gas hydrate-bearing sediments." Marine and Petroleum Geology, 120, 104566. https://doi.org/10.1016/j.marpetgeo.2020.104566
4. Choi, J.H.*, Lin, J.S., Dai, S., Lei, L., Seol, Y. (2020). "Triaxial compression of hydrate-bearing sediments undergoing hydrate dissociation by depressurization." Geomechanics for Energy and the Environment, 23, 100187. https://doi.org/10.1016/j.gete.2020.100187
5. Lei, L., Seol, Y.* (2020). "Pore-scale investigation of methane hydrate-bearing sediments under triaxial condition."Geophysical Research Letters, 47(5), e2019GL086448. https://doi.org/10.1029/2019GL086448
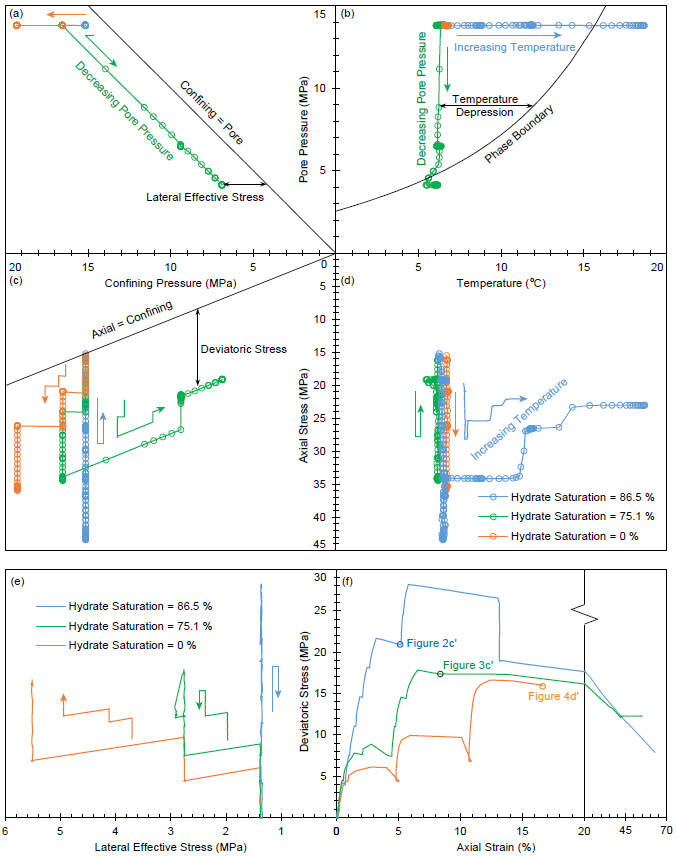
Temperature-pressures control and stress-strain behaviors in three triaxial experiments on hydrate-bearing sediments with 86.5%, 75.1% and 0% of hydrate saturation. Four parameters including temperature, pore pressure u, confining fluid pressure σc and axial stress σa are independently controlled. Temperature depression is the temperature distance between the current temperature-pressure condition and the phase boundary. Deviatoric stress q = σa - σc. Lateral effective stress σL' = σc - u. The three dots in (f) correspond to Figures 2c', 3c', and 4d'.
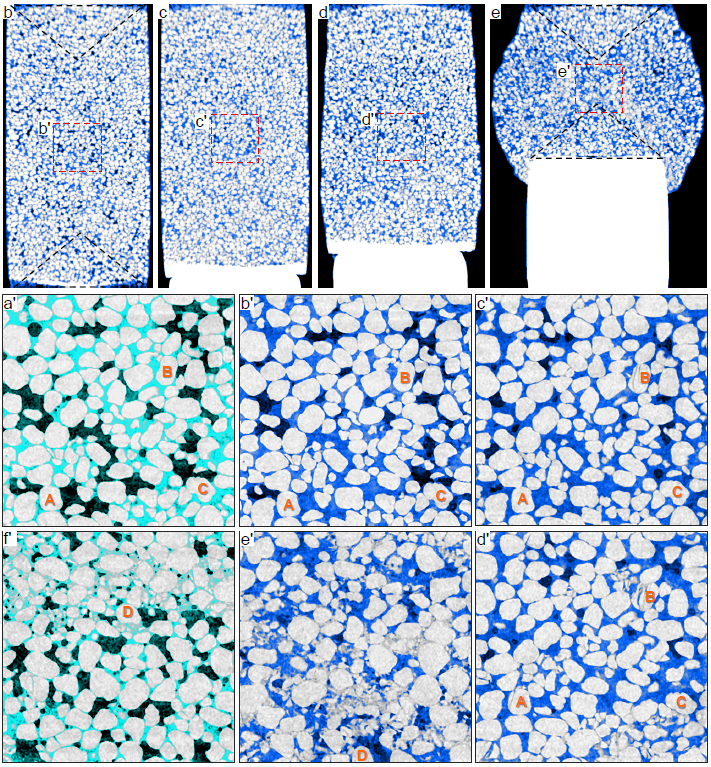
Vertical section of the methane hydrate-bearing specimen with 86.5% of hydrate saturation (Specimen 1, sand particles in light grey, hydrate in blue, water in cyan and gas in black). b-e: core scale images showing the overall deformation; and a'-f': pore scale images displaying pore-scale behaviors. The areas enclosed by red frames in b-e correspond to b'-e'. Axial strains in a'-f' are 0%, 0%, 5.3%, 13.2%, 46.4% and 62.9%. Four particles A, B, C and D are marked to help track the particle behavior. Note the increasing sand crushing starting from c'. Core scale images depict the overall hydrate distribution but are not precise at pore scale due to partial volume effect. Note that these images preserve the noise in raw CT images.
◎ 2019
1. Lei, L., Seol, Y.*, Choi, J. H., Kneafsey, T. J. (2019). "Pore habit of methane hydrate and its evolution in sediment matrix-Laboratory visualization with phase-contrast micro-CT." Marine and Petroleum Geology, 104, 451-467. https://doi.org/10.1016/j.marpetgeo.2019.04.004.
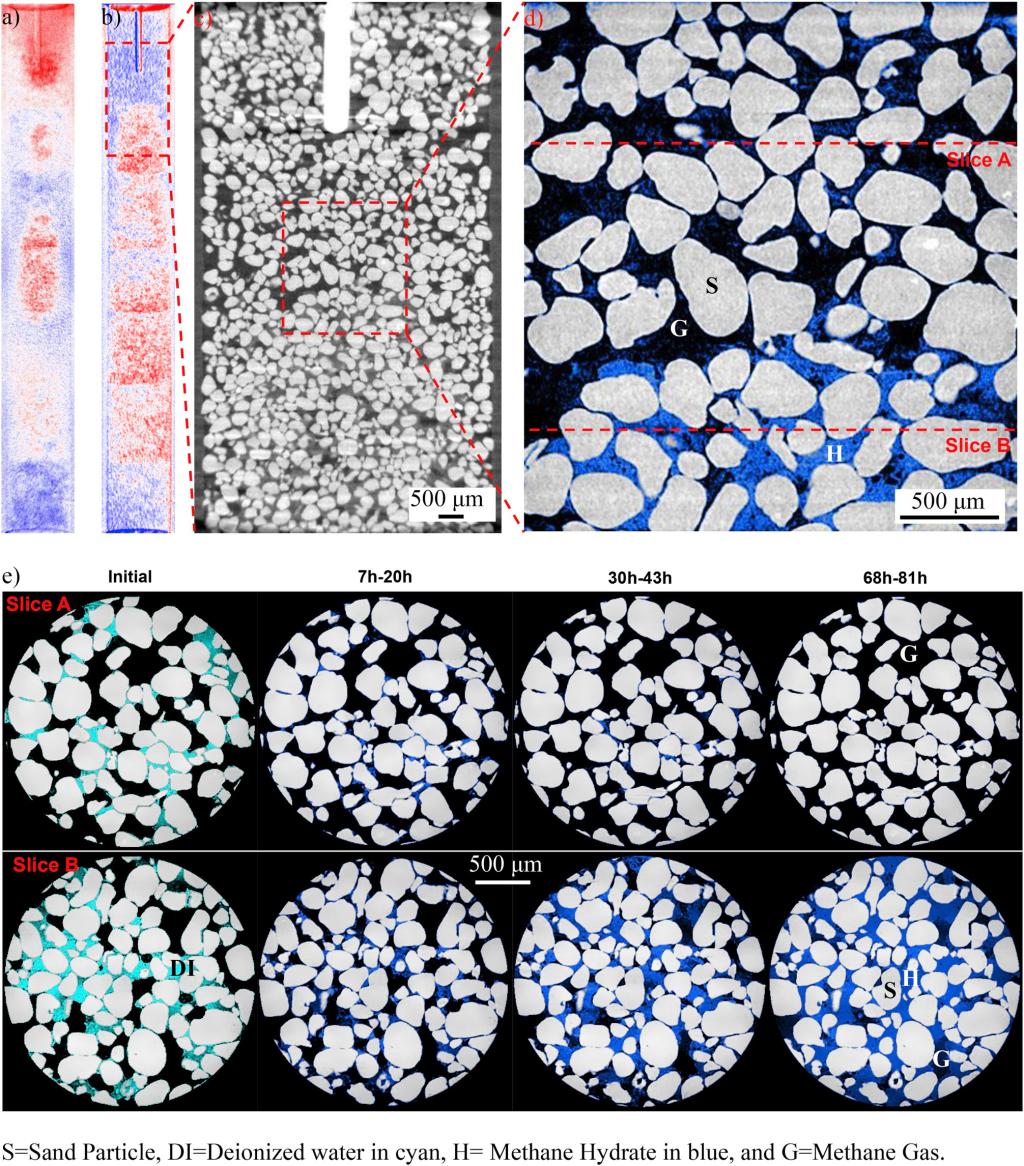
Water migration during hydrate formation (ExG-2 in Table 2). a) Projection at 5 min after the thermal spike minus projection at the reference point before hydrate formation: blue area=mass loss, red area=mass gain; b) Projection at 81 h after the thermal spike minus reference point; c) One vertical slice of the 3D reconstructed image: water is concentrated in the lower part; d) High resolution image that corresponds to the marked zone in c); e) Initial water distribution and hydrate evolution over 81 h after thermal spike at two locations shown in d): Slice B gains water from surrounding to form hydrate but slice A loses all the water at the end. (For interpretation of the references to color in this figure legend, the reader is referred to the Web version of this article.)
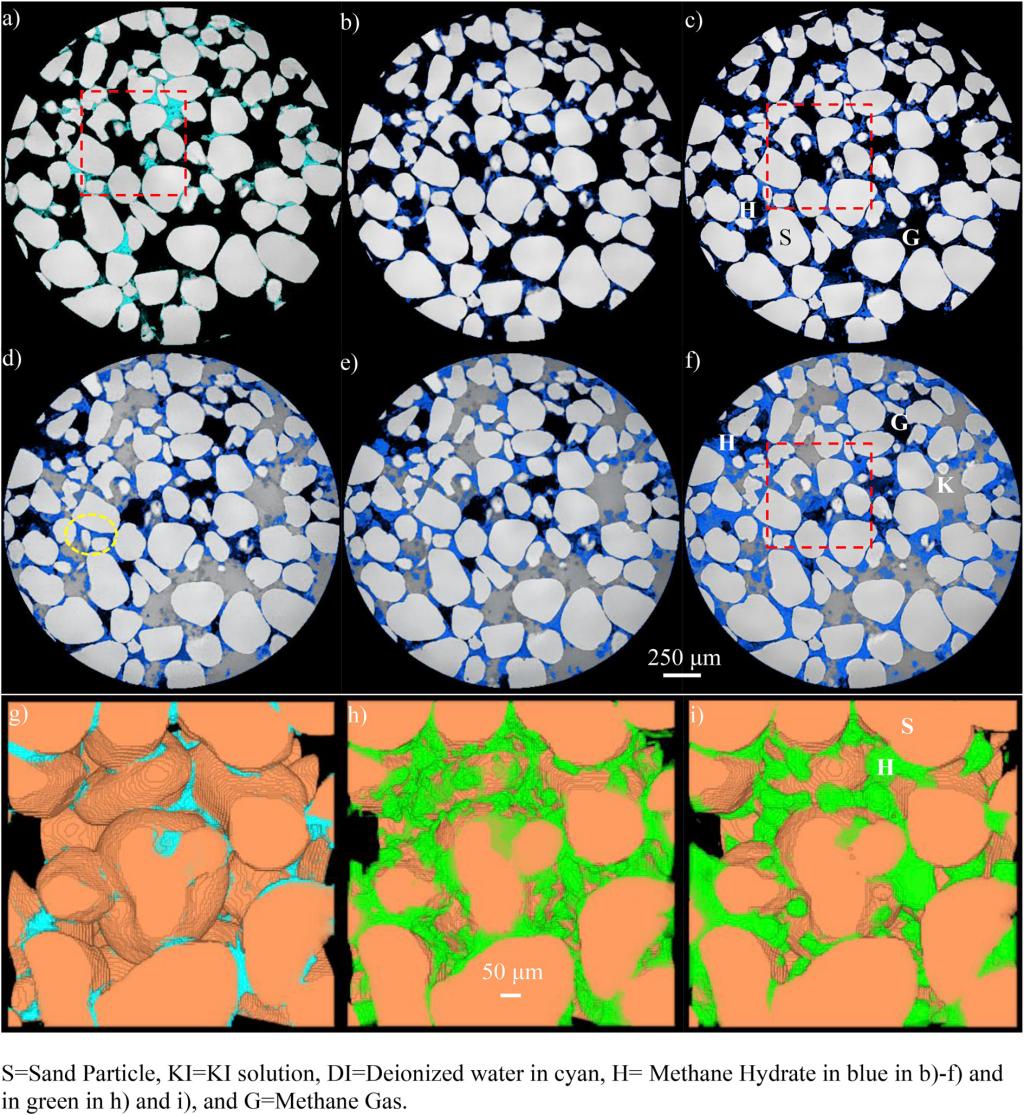
3D view of hydrate formation in gas-excess system and its morphology evolution after brine injection deep inside hydrate stability field (ExG-KI-3). a) Initial state, b) 6–18 h after thermal spike: hydrate formation in gas-excess system, c) 42–102 h after thermal spike: hydrate evolution, d) 6–18 h after KI solution injection, e) 24–36 h after KI solution injection, f) 54–114 h after KI solution injection, and g)-i) are 3D distribution of water and hydrate corresponding to the areas in the red boxes in a), c), and f) respectively. The majority of hydrate in h) evolves towards pore-filling in i) after brine injection; meanwhile yellow circled area in d) contains cementing hydrate formed in c) which remains until the end of experiment. (For interpretation of the references to color in this figure legend, the reader is referred to the Web version of this article.)
2. Lei, L., Seol, Y.*, Myshakin, E. "Methane Hydrate Film Thickening in Porous Media." Geophysical Research Letters, 46(20), 11091-11099. https://doi.org/10.1029/2019GL084450.
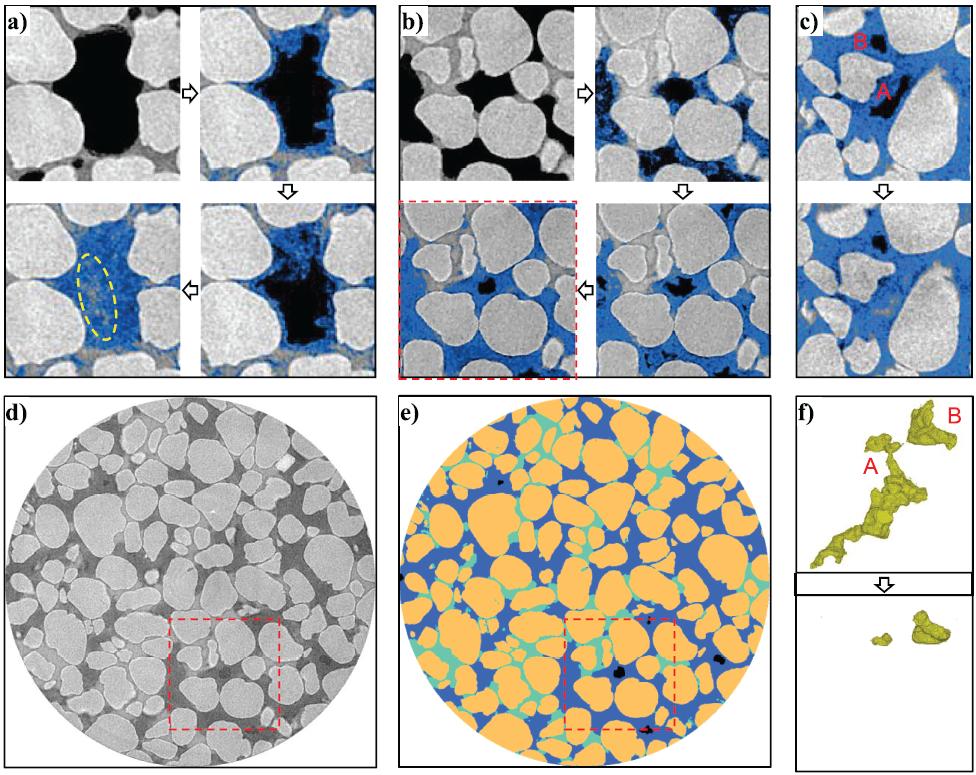
Microcomputed tomography images visualizing evolution of hydrate growth from methane bubbles in porous media. (a) Experiment 1: hydrate growth with low‐density methane; note the brine inclusion in the center of methane hydrate (yellow‐circled area). (b) Experiment 2: Hydrate growth from high‐density methane (the area is also shown in Figures 1d and 1e within a red‐dotted square). (c) Experiment 2: brine invasion into the methane bubble via induced cracks with mechanical loading on the crust. Colors in Figures 1a–1c: methane hydrate in blue and gray scale from bright to dark (quartz sand, KI solution, and free methane). Note that the false‐color images in Figures 1a–1c preserve the noise in the raw image. (d) Experiment 2: raw computed tomography image (gray scale from bright to dark: quartz sand, KI solution, methane hydrate, and free methane). (e) Experiment 2: after segmentation (sand, KI solution, methane hydrate, and free methane in brown, cyan, blue, and black, respectively). (f) 3‐D view of the two isolated methane bubbles in Figure 1c (see supporting information for animated images): the big methane bubble A was mostly flooded with brine while the small methane bubble B was compressed.
3. Lei, L., Liu, Z., Seol, Y.*, Boswell, R., Dai, S. (2019). "An Investigation of Hydrate Formation in Unsaturated Sediments Using X‐Ray Computed Tomography." Journal of Geophysical Research: Solid Earth, 124(4), 3335-3349. https://doi.org/10.1029/2018JB016125.
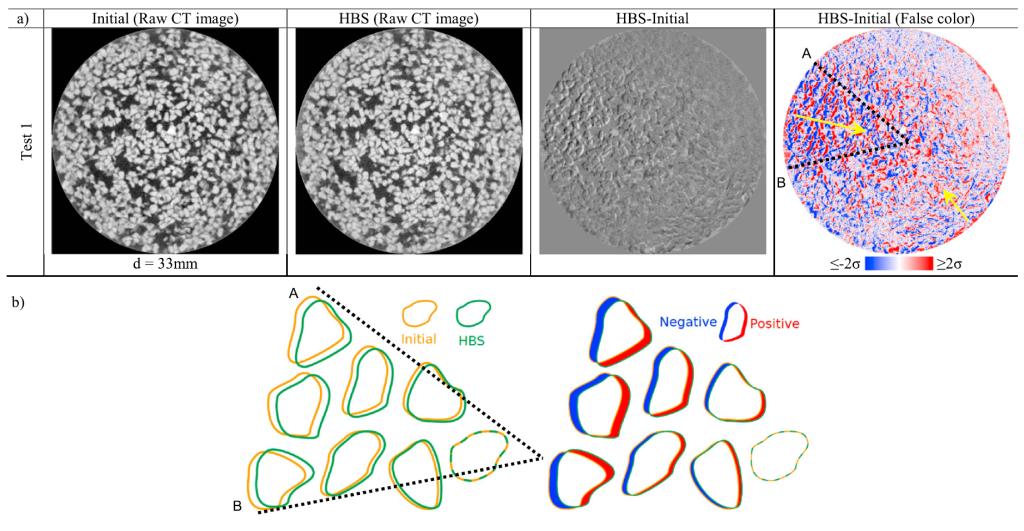
(a) Comparison between selected sections of initial and hydrate‐bearing specimen. The “HBS‐Initial” (HBS = hydrate‐bearing sediments) result shows the ripple feature caused by the lateral movement of particles. False color image improves the visualization. Red or blue colors represent a positive or negative value. The color intensity is normalized between −2σ and 2σ to enhance image contrast, where σ is the standard deviation from the mean of the image. (b) Red‐blue pair pattern formation in the area enclosed by lines A and B. The particle movement from left to right during hydrate formation creates a red‐blue pair pattern in the subtraction result. This pattern indicates the particle pushing effect by hydrate/ice formation, and the shadow thickness along the movement direction represents the movement magnitude. CT = computed tomography.
4. Lei, L.*, Santamarina, J. C. (2019). "Physical properties of fine-grained sediments with segregated hydrate lenses." Marine and Petroleum Geology, 109, 899-911. https://doi.org/10.1016/j.marpetgeo.2019.08.053.
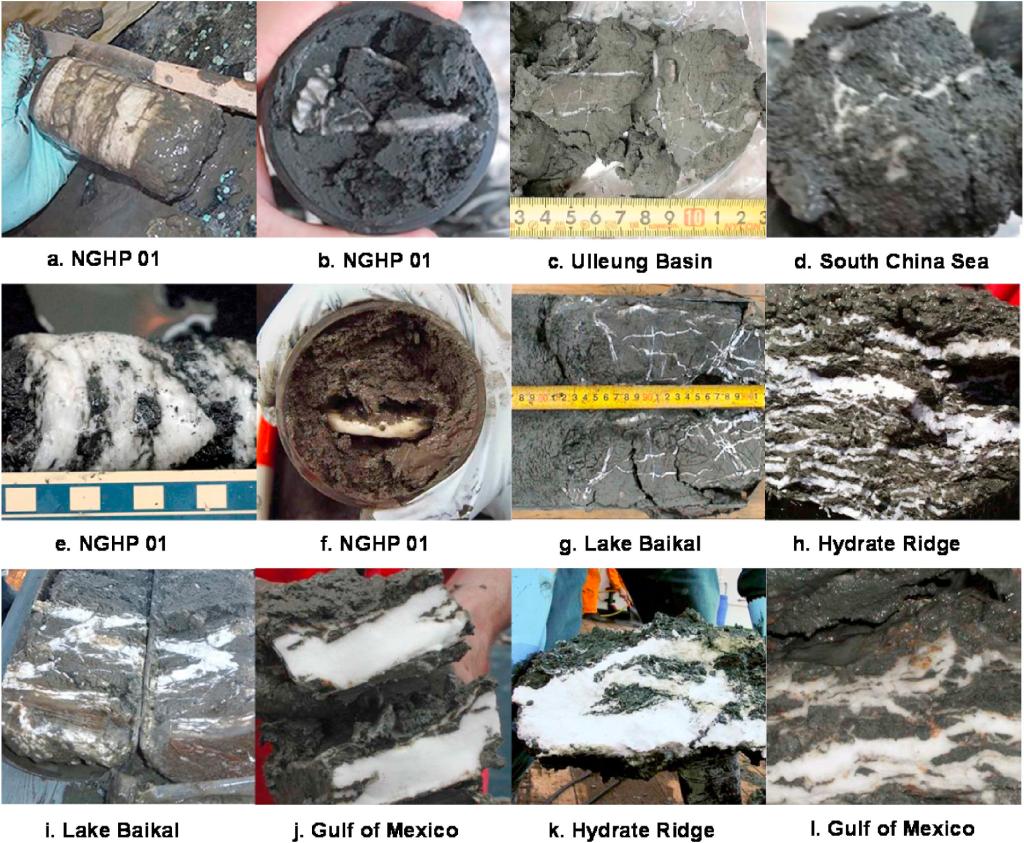
(left)Natural specimens with segregated hydrate in fine-grained sediments, photographed immediately after recovery and fast depressurization. Sources: (a, b, e, f) image courtesy of NGHP 01; (c) Park et al., 2008; (d) Zhang et al., 2014; (g, i) courtesy of Oleg Khlvstov; (h, j, k, l) courtesy of GEOMAR.
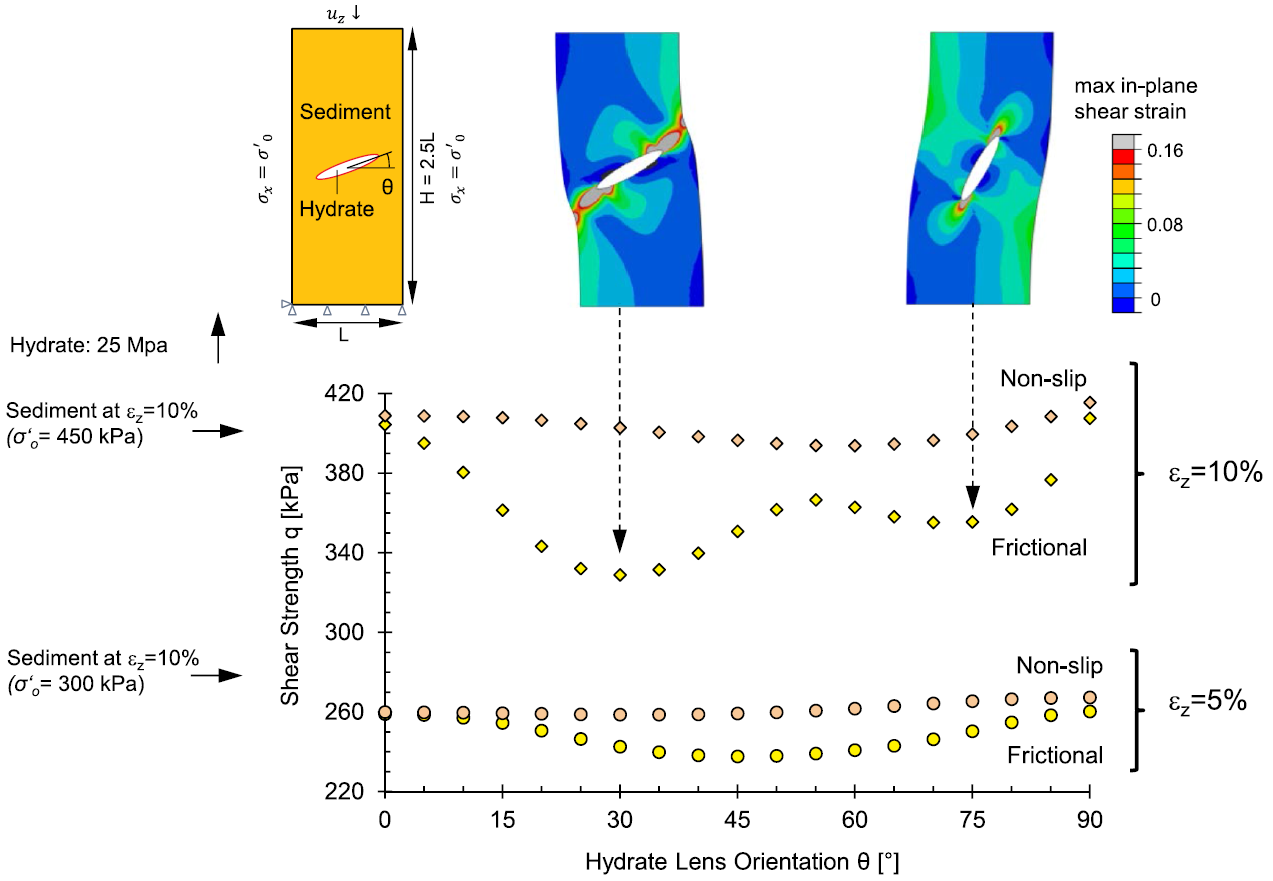
(right)Drained shear strength of a fine-grained sediment with an elliptical hydrate lens as a function of lens orientation θ for both low-friction and bonded interface conditions. Dots represent numerical simulation results reported at vertical strains εz=5% and εz=10%. The upper images show the geometry and boundary conditions (left), and the numerically computed strain fields superimposed on two deformed specimens (right). The initial condition and all parameters correspond to a sediment subjected to 450 kPa, hydrate saturation Fh=4.71%. Model parameters in Table 2.
5. Lei, L., Seol, Y.* (2019). "High‐Saturation Gas Hydrate Reservoirs-A Pore Scale Investigation of Their Formation From Free Gas and Dissociation in Sediments." Journal of Geophysical Research: Solid Earth, 124(12), 12430-12444. https://doi.org/10.1029/2019JB018243.
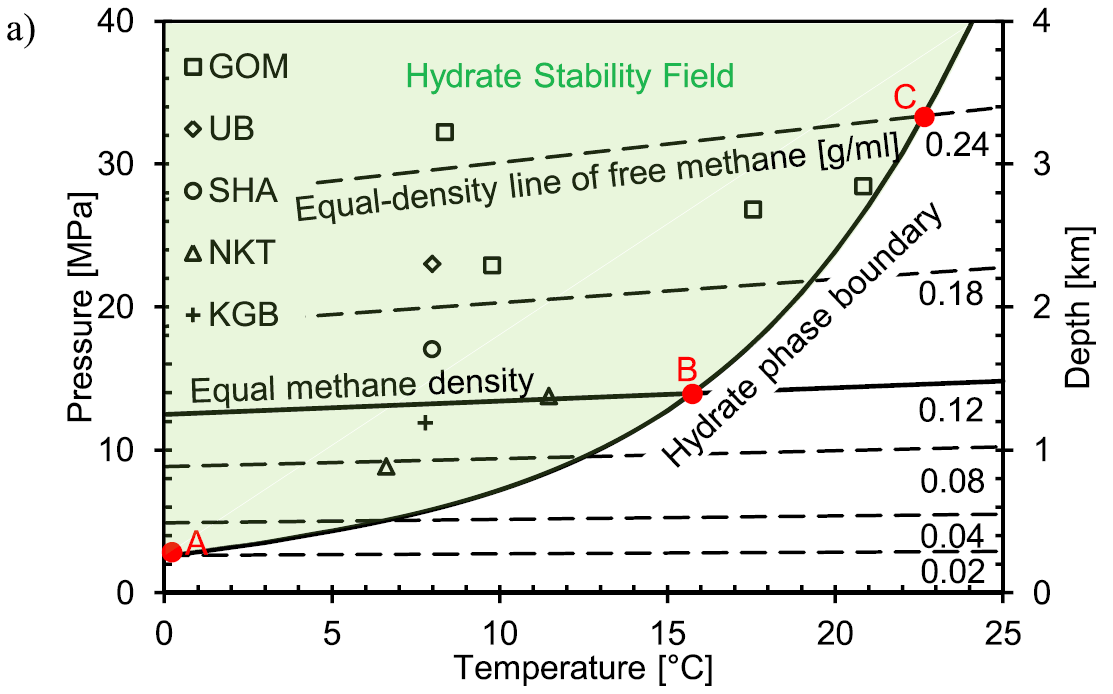
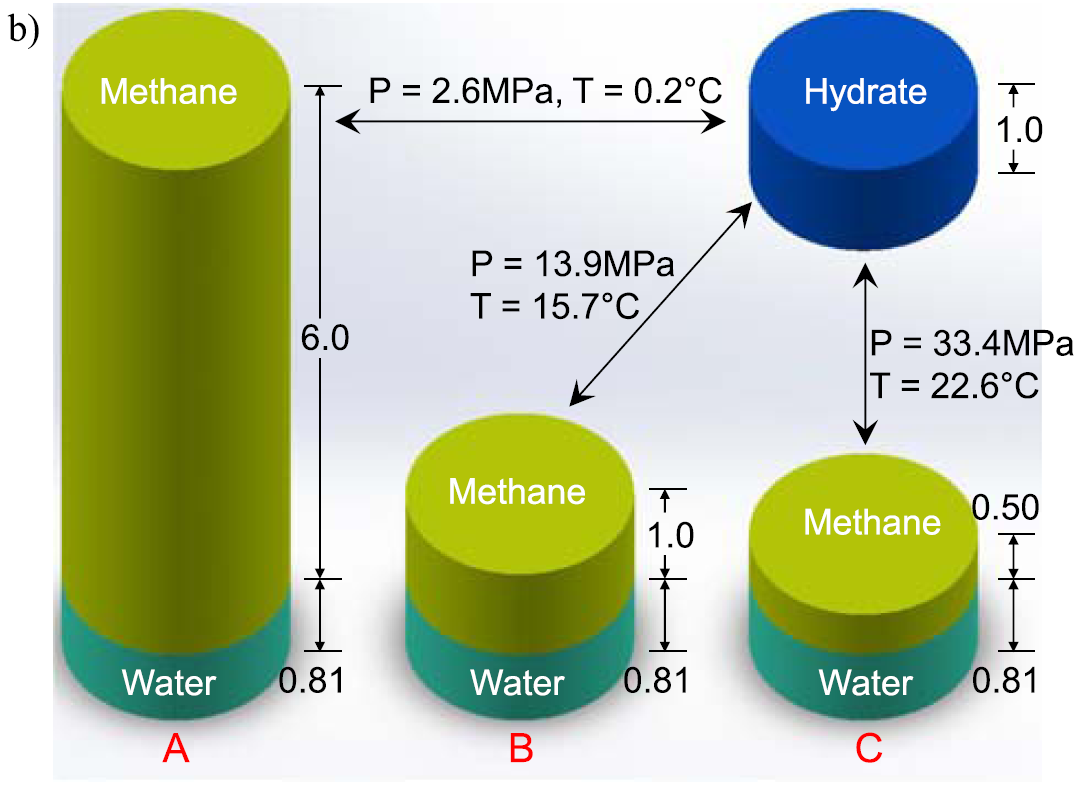
Stability condition of natural methane hydrate and free methane density as a function of pressure and temperature. See conditions found at natural sites (Boswell et al., 2009; Boswell & Collett, 2011; Collett et al., 2015; Lee et al., 2013; Uchida et al., 2004; Wu et al., 2011), GOM = Gulf of Mexico; UB = Ulleung Basin; SHA = Shenhu Area; NKT = Nankai Trough; KGB = Krishna–Godavari Basin. Methane density in methane hydrate is constant at 0.12 g/ml, while methane density in free methane varies depending on the pressure and temperature. If hydrate forms or dissociates at the equal methane density point (Point B), the volume of free methane and methane hydrate before and after the transformation is the same, that is, the initial free methane saturation is the same with the resulted hydrate saturation. If dense methane is used for formation, for example, methane density of 0.24 g/ml (Point C), one volume of free methane can produce two volumes of methane hydrate. Conversely, two volumes of methane hydrate release one volume of free methane during hydrate dissociation. Water vapor in gas phase and methane dissolved in water are negligible.
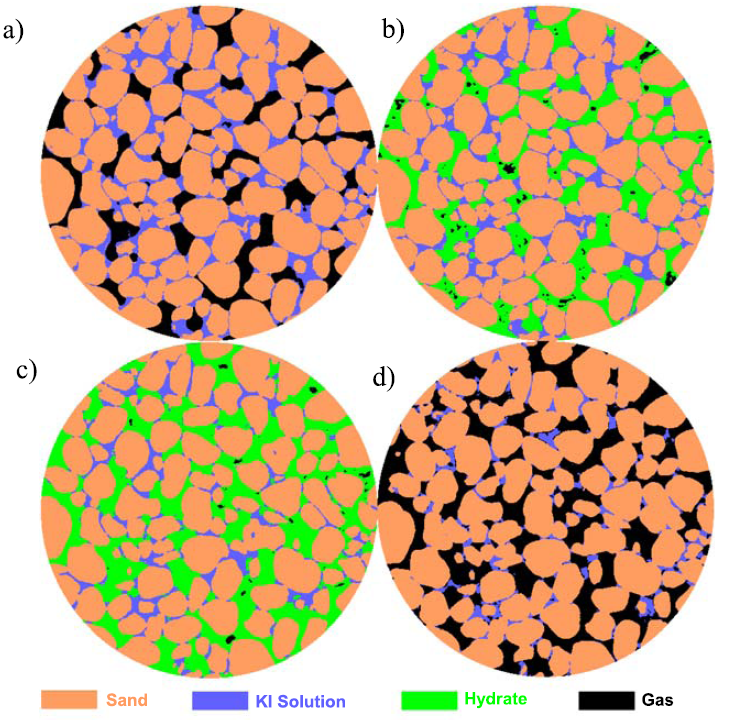
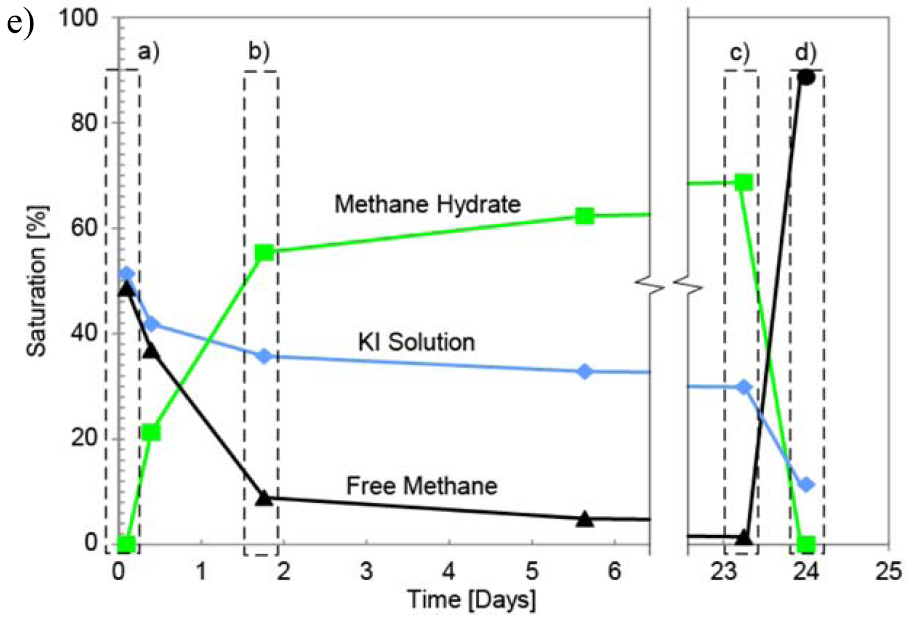
CT images of hydrate formation and dissociation in Test 2, with 50% initial water saturation at 24.1 MPa: (a) initial stage, with water patches in zones with small pores; (b) demonstrates a fast hydrate growth period when the salt concentration increases rapidly and 80% of the hydrate formation occurs in the first 2 days; (c) shows the resulted hydrate morphology after 690 hr (~29 days), with brine separated from free methane by a layer of methane hydrate; (d) most of the pores are filled with methane after dissociation, and brine saturation is lower than the initial state; and (e) phase saturation evolution versus time. If we assume mass conservation of methane within the scanned area, the final hydrate saturation should be 74%, higher than the actually achieved 70%. Two factors contribute to this result: (1) the scanned area exchanges mass with the rest of the specimen since there is no physical boundary in between, and (2) there is a slow gas loss toward the top of the specimen. Similarly, the gas saturation after hydrate dissociation is 86%, higher than the expected ~70% according to mass conservation of methane, which attributes to (1) the mass exchange between the scanned area and the rest of the specimen and (2) the compression in pore volume during depressurization. The syringe pump connected to the top of the specimen maintains the constant pressure during and after dissociation; therefore, the gas loss is compensated and does not affect the specimen.
6. Seol, Y., Lei, L.*, Choi, J., Jarvis, K., Hill, D. (2019). "Integration of triaxial testing and pore-scale visualization of methane hydrate bearing sediments." Review of Scientific Instruments, 90(12), 124504. https://doi.org/10.1063/1.5125445.
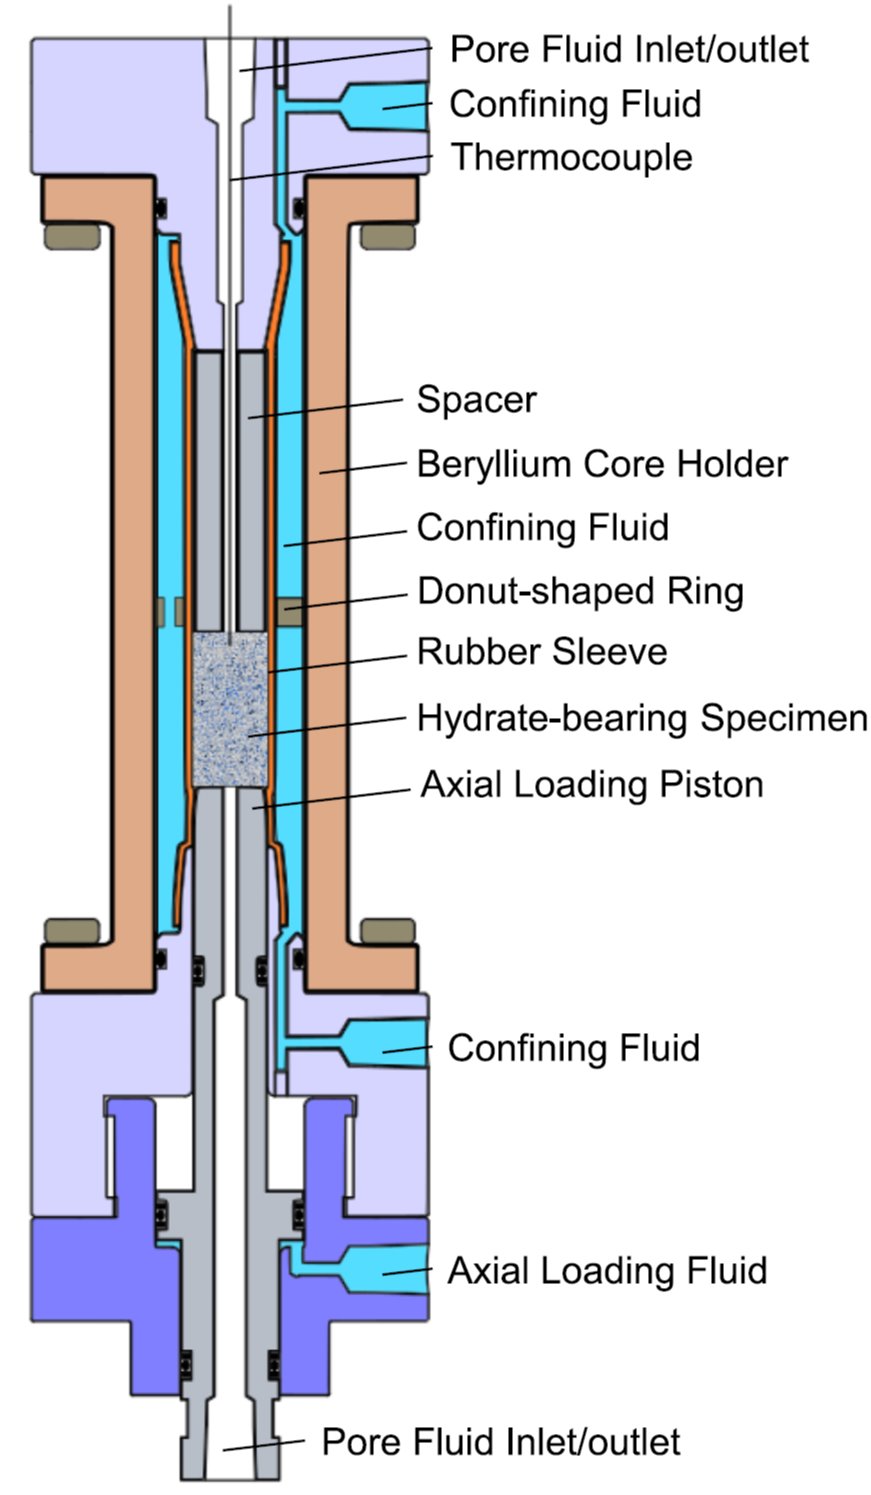
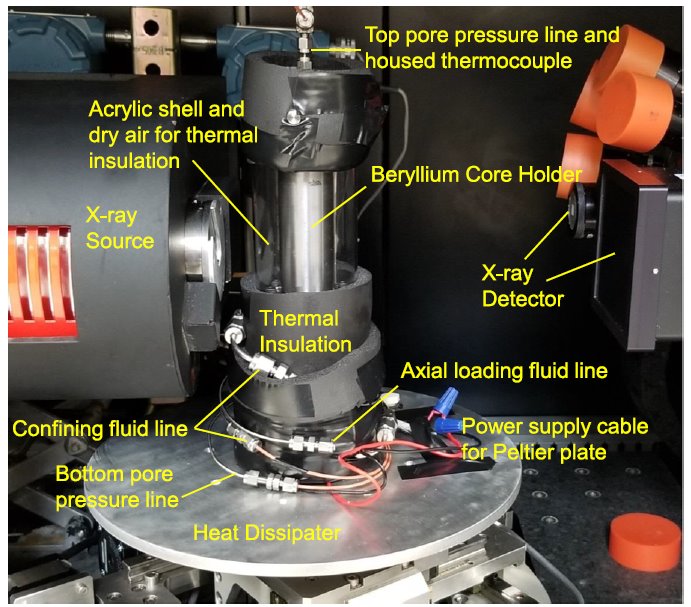
(left)Structure of the core holder with functional end caps.
(right)Configuration in the micro-CT scanner. (Note) The Peltier plate is on top of the heat dissipater and hidden inside the thermal insulation.
7. Liu, Z., Kim. J., Lei, L., Ning, F.*, Dai, S.* (2019). "Tetrahydrofuran hydrate in clayey sediments-Laboratory formation, morphyology, and wave characterization." Journal of Geophysical Research: Solid earth, 124(4), 3307-3319. https://doi.org/10.1029/2018JB017156.
◎ 2018
1. Lei, L., Seol, Y.*, Jarvis, K. (2018). "Pore-Scale Visualization of Methane Hydrate-Bearing Sediments With Micro-CT." Geophysical Research Letters, 45(11), 5417-5426. https://doi.org/10.1029/2018GL078507.
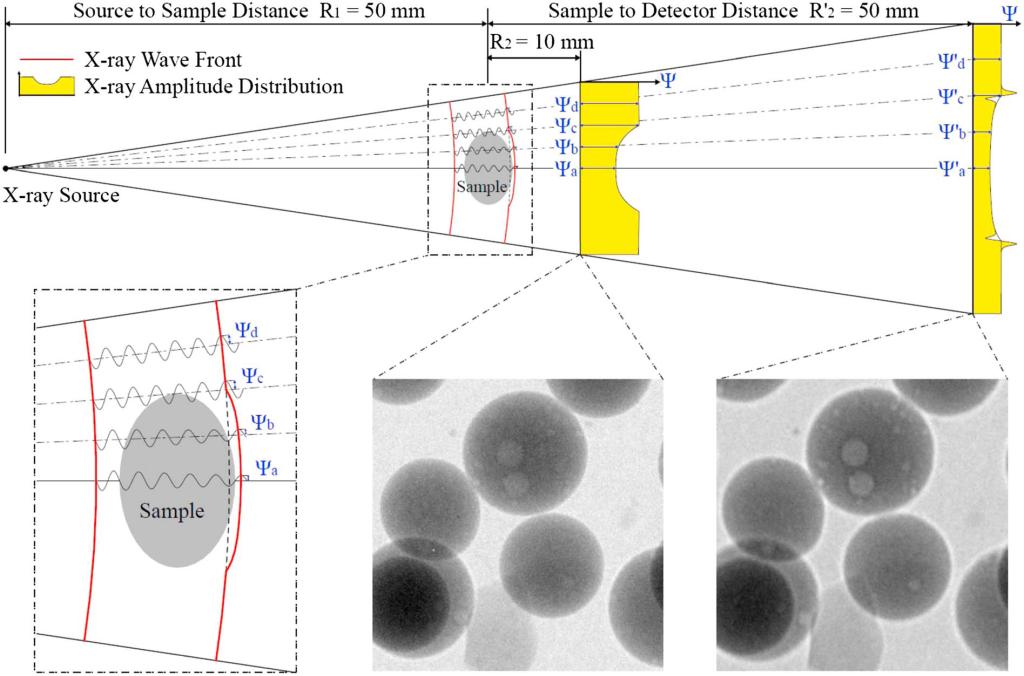
General schematic of amplitude Ψ (= I1/2) and phase evolution during X-ray wave propagation in CT scans (for demonstration only; X-ray wavelength, amplitude, and wavefront are not to scale). Diffraction occurs due to the disrupted wavefront. Radiograph images taken at a short propagation distance (R2) approximate the pure attenuation case. Longer propagation distance (Rˊ2) reveals fine details in the glass beads by enhanced edge features.
2. Lei, L.*, Santamarina, J. C. (2018). "Laboratory Strategies for Hydrate Formation in Fine-Grained Sediments." Journal of Geophysical Research: Solid Earth, 123(4), 2583-2596. https://doi.org/10.1002/2017JB014624.
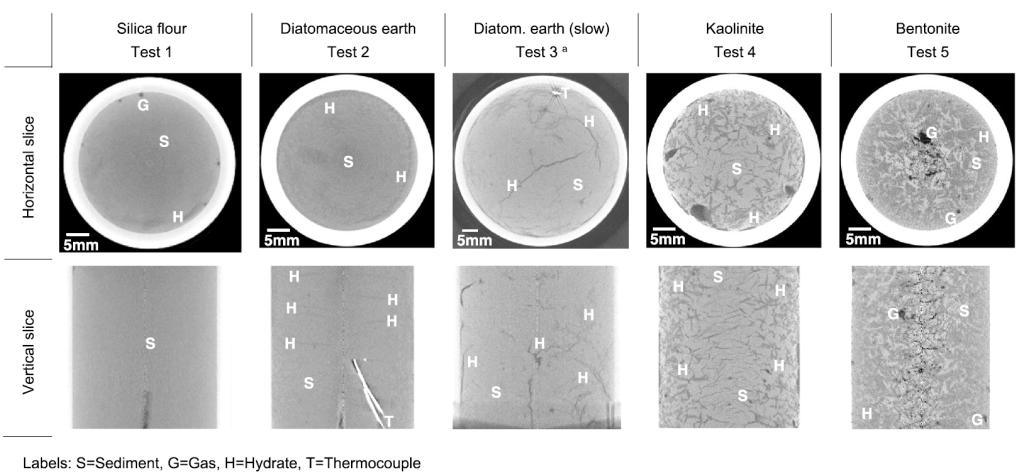
Tetrahydrofuran (THF) hydrate morphology in different sediments. All specimens are housed inside the aluminum chambers and cooled in a water bath, except for the slow-cooling test 3 where the diatomaceous earth specimen is housed in a plastic tube and cooled in an air-bath. The saturating fluid is stoichiometric THF solution in all tests. Various hydrate morphologies are observed. Test 1: disseminated hydrate with minor segregation near the upper free boundary. Test 2: peripheral hydrate ring and parallel horizontal lenses toward the center of the specimen. Test 3: peripheral hydrate ring and large vertical lens across the center. Test 4: multiple peripheral lenses with fewer lenses toward the center. Test 5: massive hydrate surrounds clay inclusions (brighter features), and excluded air remains at the center.
Digital Porous Media Laboratory (DPML)
18 Shilongshan Road, Hangzhou, Zhejiang, China
中国浙江省杭州市西湖区云栖小镇石龙山街18号

 浙公网安备 33010602007514号 |